Application Usage Statistics
As a PC-lint Plus View administrator, you may need to keep track of the usage of the platform and report on its overall performance. This information is now available directly within PC-lint Plus View via the Administration > Statistics page.
If you are also a model developer or a project manager and wish to fine-tune the layout of your dashboards, you will find more statistical data about how users consult analysis results via Models > Statistics and the Manage Project page. This section describes the information you can access from these pages.
Note that statistics are collected locally, saved in the PC-lint Plus View database, and never sent anywhere. Statistics collection cannot be turned off.
|
Before you can view statistics on these pages, a date range must be selected in order to display information about the activity on the server during this period. You can also select whether the information is aggregated by day, week, month or year by adjusting the granularity setting. 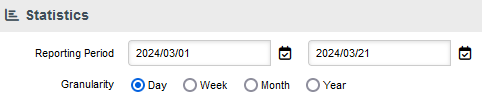
|
Statistics for administrators
The application usage statistics are broken down into five sections where you can view information about users, projects, hardware resources, pages response time and dashboard usage.
Users
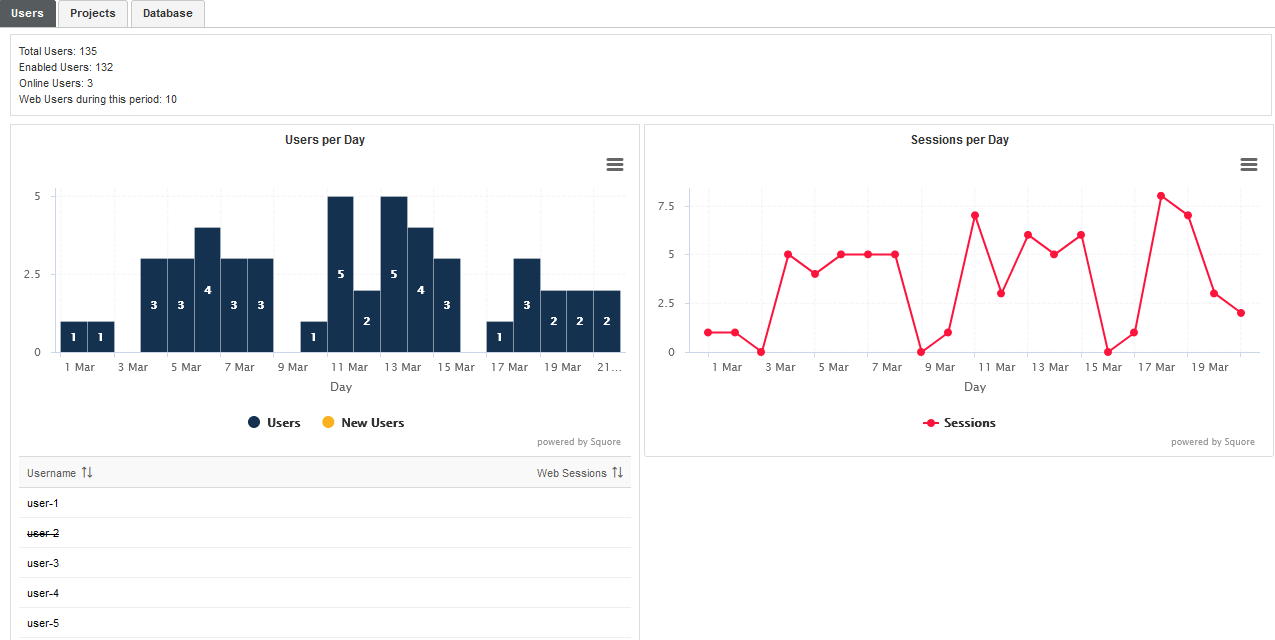
The Users tab displays the following information:
-
Global statistics about user accounts for this PC-lint Plus View server installation
-
Information about current web users during the selected period
-
A series of charts containing information about the number of users, new users and overall connections to the server during the selected period
-
A table detailing session information per user
-
A table displaying session duration statistics
Projects
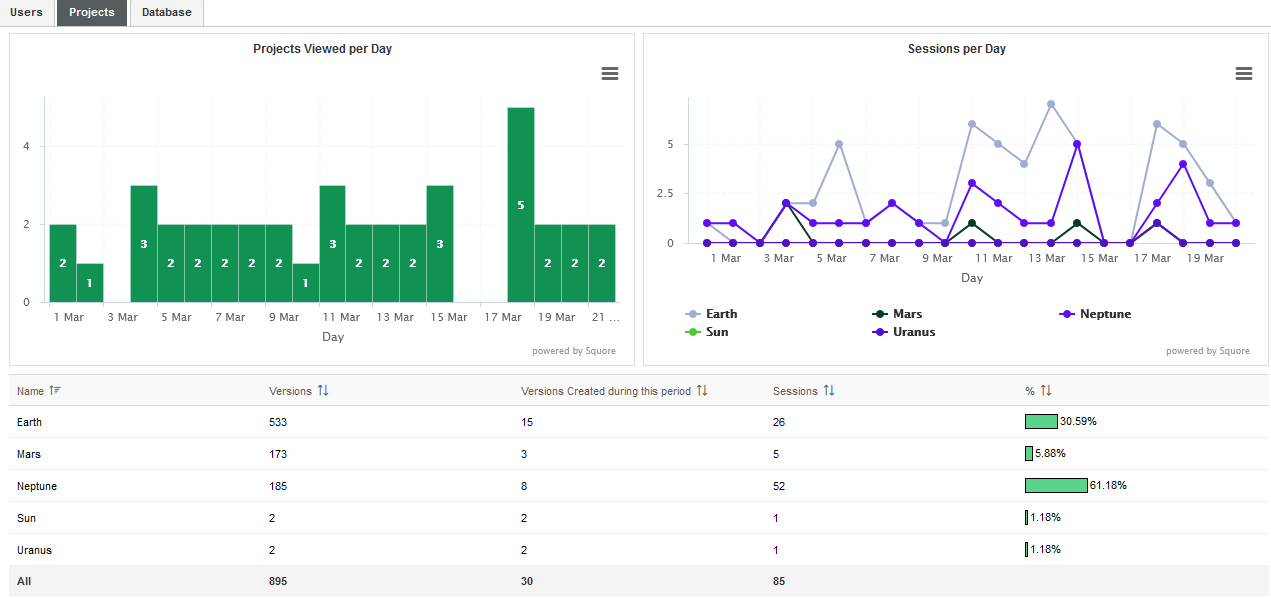
The Projects tab displays information about the number of projects viewed. You can get overall numbers of visits for all the projects on the server, or select specific projects to compare their number of views. The data is rendered as:
-
A chart showing a trend of the total number of projects viewed for the selected reporting period
-
A chart where you can consult detailed view statistics about the projects of your choice. You can click on a project name to show or hide it from the chart.
-
Information about the number of sessions per project during the selected period
Statistics for project managers
As a project manager, you can use project statistics to investigate the popularity of your project by going to Manage project > Statistics.
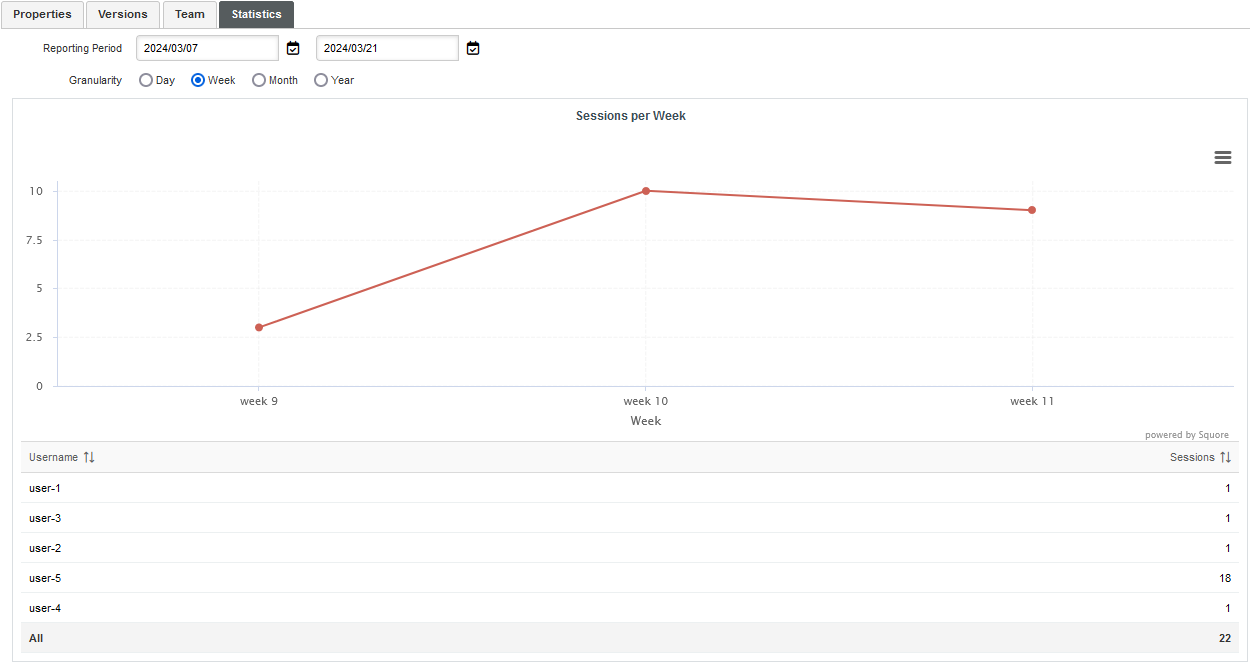
When you select a reporting period, the following information is displayed:
-
The trend of the number of user sessions for this project.
-
A table that summarises the breakdown of sessions per user.